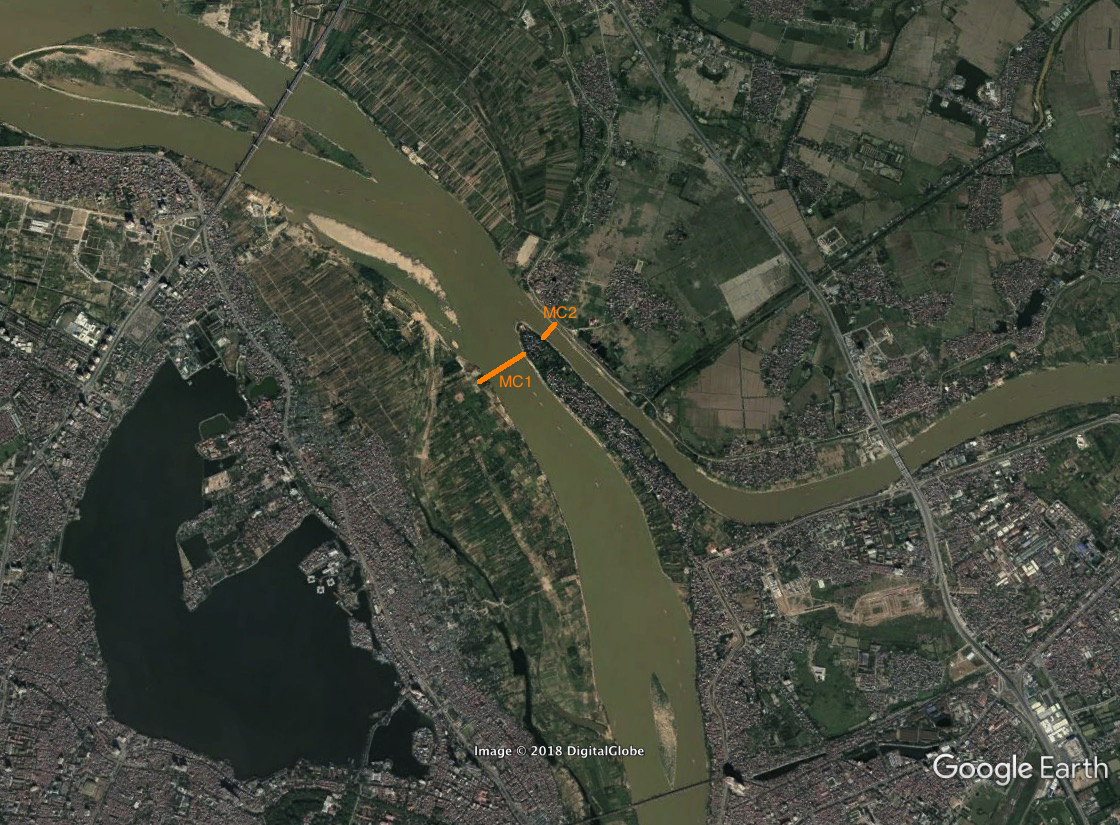
Field survey at junction of Red and Duong Rivers
- Summary
- Conducted on 23-Mar-2018, the survey was designed to collect data on velocity profiles and near-surface suspended sediment concentration at each bifurcation of the Duong river junction. Velocity profiles were measured using ADP mounted on a boat, while the sediment concentration was determined using filter-and-weight method from water samples taken close to the river surface.
Water level
The water level during this field survey should be checked against records from nearby hydrographic stations (Hanoi, Duong). A photoshot of the fixed level meters at Long Bien bridge pile show that at 8:00 am, the local water level was ~1.20 m.
Discharge data
Measurement by ADCP device was made along two cross-sections of the river bifurcation.

The river discharge was automatically calculated by SonTek’s specialized software. A series of measurements are listed in Table 1.
Table 1. Measured discharge (and time) of Red and Duong Rivers.
| Red River | Duong River |
|---|---|
| 931 m3/s (9:03) | 643 m3/s (10:07) |
| 934 m3/s (9:09) | 743 m3/s (10:09) |
| 833 m3/s (9:13) | 592 m3/s (10:12) |
| 920 m3/s (9:18) | 721 m3/s (10:15) |
| 812 m3/s (9:25) | 579 m3/s (10:18) |
| 886 m3/s (9:33) | 683 m3/s (10:21) |
| 750 m3/s (9:43) | 539 m3/s (10:24) |
| 696 m3/s (10:27) | |
| 634 m3/s (10:30) | |
| 773 m3/s (10:35) | |
| 783 m3/s (10:39) |
Profiles
This type of data is most important in modeling. The dataset in the share folder contains 60 measured cross-sections, from which data can be extracted using SonTek’s specialized software.
Sediment data
Six sediment samples (three in the Red River, three in Duong River1) had been collected. The sampling depth was about 0.2 m from water surface. Sample volume ranges from 420 mL to 460 mL.
Filters (weight ~ 0.52 g) are encapsulated heated at 103°C during 30 mins and then demoisturized during another 30 mins. The encapsulated filters are then weighed (using a device with precision 0.1 mg). After filtering out samples had been done, the encapsulated soiled filters are heated and demoisturized as before. They are again weighed and the differences in weights are due to sediment in the samples.
Table 2: Suspended sediment samples
| No. | Location | Sample Vol.2 | Sed. weight | Concentration |
|---|---|---|---|---|
| 1 | Right, Red River | 450 ± 10 mL | ~03 | ~0 g/m3 |
| 2 | Mid., Red River | 450 ± 10 mL | 9.3 mg | 20.2–21.1 g/m3 |
| 3 | Left, Red River | 450 ± 10 mL | 19.6 mg | 42.6–44.5 g/m3 |
| 4 | Right, Duong River | 452 mL | 16.4 mg | 36.3 g/m3 |
| 5 | Mid., Duong River | 420 mL | 15.5 mg | 36.9 g/m3 |
| 6 | Left, Duong River | 440 mL | 13.9 mg | 31.6 g/m3 |
It can be seen that the sediment in Duong reach is more well mixed than in Red River. Also, the samples near the junction contains more suspended sediment, which is an indication of turbulent mixing.
Figure — Encapsulated soiled filters, with samples number 1,2,3 on top row starting from left; samples 4,5,6 bottom row starting from left.
Exact locations are shown in this KML file. The sampling times were around 9:55 for samples 1,2,3, and 10:50 for samples 4,5,6. ↩︎
The reporter inadvertently failed to measure volumes of samples 1,2,3. But the water level in these samples are higher than the upper edge (~440 mL) of the label on the PET plastic bottle, and the bottles were not nearly as full (500 mL) because they were poured from the almost full 500-mL PVC container of the sampler. ↩︎
This is likely due to error in weighting the encapsulated unsoiled filter. Transparent door might not be closed properly, leading to a slow but gradual rise in displayed weight. ↩︎